WQI Data and Calculations Sheet
Stream or Lake__Oak Lake______________ Names __Mickelson Middle School___________
Date____9/16/2008_______
Directions:
|
||||||||||||||||||||||||||||||||||||||||||||||||||||||||||||||||||||||||||||||||||||||||||||||||||||||||||||||||||||||||||||||||||
|
||||||||||||||||||||||||||||||||||||||||||||||||||||||||||||||||||||||||||||||||||||||||||||||||||||||||||||||||||||||||||||||||||
| Date: 9/9/2004 | ||||||||||||||||||||||||||||||||||||||||||||||||||||||||||||||||||||||||||||||||||||||||||||||||||||||||||||||||||||||||||||||||||
| Group # | Time of Day | pH | Temperature
Degrees celsius |
Dissolved O2 | Carbon Dioxide | Secchi Disk | ||||||||||||||||||||||||||||||||||||||||||||||||||||||||||||||||||||||||||||||||||||||||||||||||||||||||||||||||||||||||||||
| 1 | 9:30 a.m. | 7.5 | 19.5 0 C | 11 ppm | 11.3 ppm | 37.5 cm | ||||||||||||||||||||||||||||||||||||||||||||||||||||||||||||||||||||||||||||||||||||||||||||||||||||||||||||||||||||||||||||
| 2 | 10:00 a.m. | 7 | 16.6 0 C | 10 ppm | 10 ppm | 44.4 cm | ||||||||||||||||||||||||||||||||||||||||||||||||||||||||||||||||||||||||||||||||||||||||||||||||||||||||||||||||||||||||||||
| 3 | 10:30 a.m. | 8 | 17 0 C | 8 ppm | 8 ppm | 51 cm | ||||||||||||||||||||||||||||||||||||||||||||||||||||||||||||||||||||||||||||||||||||||||||||||||||||||||||||||||||||||||||||
| 4 | 11:00 a.m. | 7 | 17 0 C | 9 ppm | 9 ppm | 49 cm | ||||||||||||||||||||||||||||||||||||||||||||||||||||||||||||||||||||||||||||||||||||||||||||||||||||||||||||||||||||||||||||
| 5 | 11:30 a.m. | 7.6 | 18.6 0 C | 11.6 ppm | 11.6 ppm | 70 cm | ||||||||||||||||||||||||||||||||||||||||||||||||||||||||||||||||||||||||||||||||||||||||||||||||||||||||||||||||||||||||||||
| Average | ------------- | 7.4
|
17.7 0 C | 10 ppm | 10 ppm | 50 cm | ||||||||||||||||||||||||||||||||||||||||||||||||||||||||||||||||||||||||||||||||||||||||||||||||||||||||||||||||||||||||||||
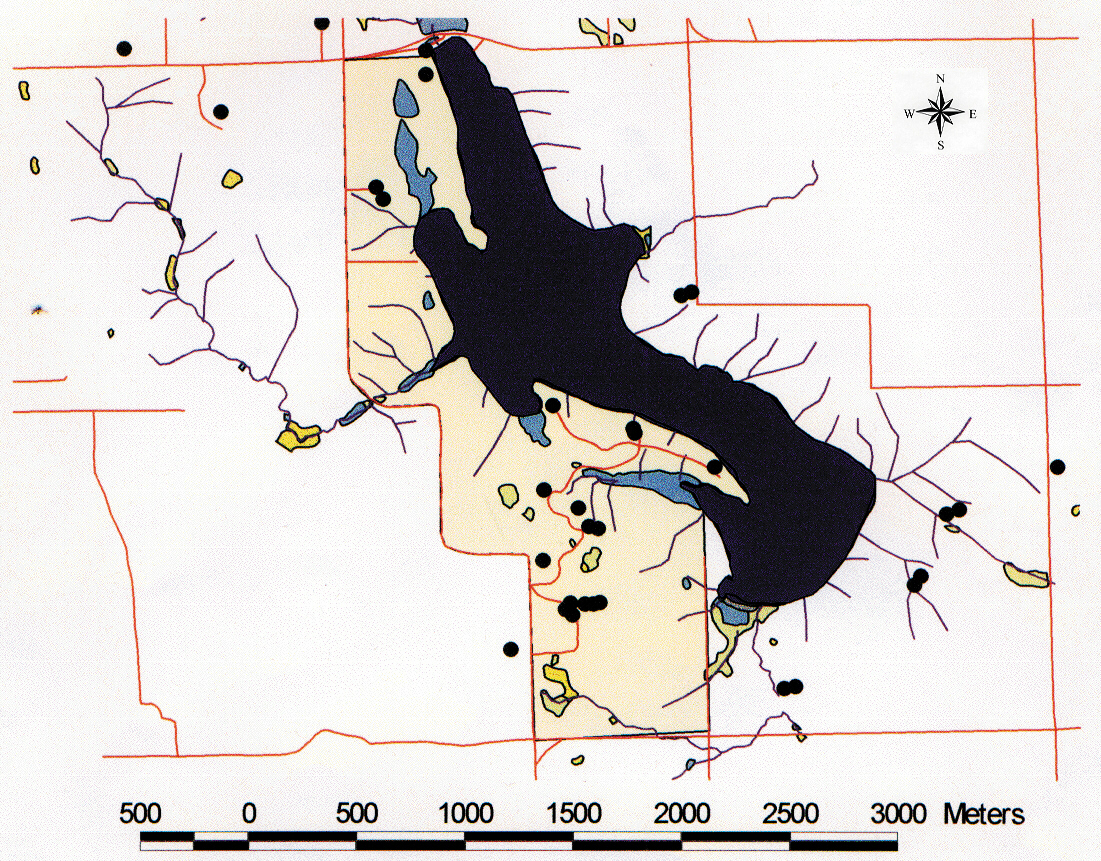
Oak Lake is a prairie pothole formed approximately 14,000 years ago following recession of glacial ice sheets. Major attributes of the Oak Lake landscape, drainage basin and lake basin are listed in the tables below. Lake monitroing is conducted by field station staff biweekly during the ice-free months (April to October). Monitoring data for the lake basin are available upon request from the Field Station Director.
| EPA Ecoregion | Northern Glaciated Plains |
| Major Drainage | Mississippi River |
| Minor Drainage | Minnesota River |
| Drainage Area | 1,682 ha (4156 acres) |
| Drainage Count | 99 |
| Drainage Density | 1.9 streams km per km2 |
| Basin Area | 163 ha (402 acres) |
| Basin Perimeter | 9.8 km (6.1 mi) |
| Basin Volume | 1.8 x 10⁶ m3(6.4x107ft3) |
| Average Depth | 1.1 m(3.7 ft) |
| Maximum Depth | 2.0 m(6.6 ft) |
| Basin Length | 3,081 m(1.9 mi) |
| Basin Width | 988 m(0.6 mi) |
| Shoreline Development | 2.17 |
| % Basin < 1.5 m Deep | 73% |
| Attribute | Summer Averages | Summer Ranges |
| Trophic Status | Hypereutrophic | -- |
| Carlson Trophic State Index | 75 | 52 - 142 |
| Secchi Depth | 35 cm | 5 - 180 |
| Water Temperature | 17.4oC | 2.5 - 30.0 |
| Dissolved Oxygen | 10.0 mg/L | 2.8 - 15.0 |
| pH | 8.6 | 7.4 - 9.4 |
| Specific Conductance | 464 uS/cm | 207 - 778 |
| Total Dissolved Solids | 302 mg/L | 135 - 505 |
| Fecal Coliform Levels | < 10 MPN/100ml | <10 - 180 |
| Oak Lake Water Conditions September 2002 | |||||||||||||
|
|||||||||||||
| Date: 9/2002 | |||||||||||||
| Group # | Time of Day | pH | Temperature | Dissolved O2 | Carbon Dioxide | ||||||||
| 1 | 9:00 | 7 | 19 | 7.6 | 5 | ||||||||
| 2 | 9:45 | 6.9 | 20 | 8.1 | 5.2 | ||||||||
| 3 | 10:30 | 6.5 | 18 | 6.2 | 1.7 | ||||||||
| 4 | 11:45 | 6.2 | 18 | 4.75 | 9.3 | ||||||||
| 5 | 12:30 | 7 | 18 | ------------ | 41 | ||||||||
| Average | ------------- | 6.72 | 18.6 | 6.6625 | 12.44 | ||||||||
|
|||||||||||||
|
|||||||||||||
| Date: 9/12/2003 | |||||||||||||
| Group # | Time of Day | pH | Temperature
Degrees celsius |
Dissolved O2 | Carbon Dioxide | Secchi Disk | |||||||
| 1 | 9:30 | 7.0 | 20 C | 9.7 | 10.3 | 22.2 | |||||||
| 2 | 10:00 | 7.3 | 17.4 | 1.3 | 13 | 28.4 | |||||||
| 3 | 10:30 | 7.2 | 19.3 | 5.8 | 25.8 | 35 | |||||||
| 4 | 11:00 | 7.2 | 19.4 | 7.2 | 25.8 | 38 | |||||||
| 5 | 11:30 | 7.2 | 18.6 | 6.5 | 21.6 | 29.6 | |||||||
| Average | ------------- | 7.2
|
18.9 | 6.1 | 19.3 | 30.6 | |||||||